Market Overview Financial Year 2022‑23
18 August 2023Section Heading
Key highlights
- All investment options delivered positive returns. The Triple S Balanced Default Option returned 1.9% for the quarter (1 April 2023 to 30 June 2023) and 9.6% for the year (30 June 2022 to 30 June 2023).
- The Socially Responsible investment option delivered a standout performance of 12.1% and it was also a top performing investment option within the broader superannuation industry.
- Our strong performance was predominately driven by Australian and international equity asset classes which returned 14.9% and 18.5% respectively, to 30 June 2023.
- Central banks continued to raise cash rates to prioritise the reduction of inflation. The Reserve Bank of Australia (RBA) increased the Official Cash Rate to 4.1%.
- Inflation has retreated from its peak in numerous major economies, without triggering a recession. However, given the projected sluggish economic growth rates, the possibility of recession remains

Triple S returns to 30 June 2023
|
Investment option |
3 months |
1 year |
3 years |
5 years |
10 years |
|
Cash |
1.0 |
3.0 |
1.1 |
1.2 |
1.8 |
|
Capital Defensive |
-0.1 |
4.1 |
1.3 |
2.2 |
3.7 |
|
Stable |
0.6 |
5.9 |
3.1 |
3.3 |
5.0 |
|
Moderate |
1.3 |
7.8 |
5.3 |
4.6 |
6.3 |
|
Socially Responsible |
2.5 |
12.1 |
8.6 |
6.4 |
7.3 |
|
Balanced |
1.9 |
9.6 |
7.7 |
6.1 |
7.8 |
|
High Growth |
2.4 |
10.8 |
9.0 |
6.7 |
9.0 |
Returns net of fees and gross of tax, based on Super SA unit pricing formula.
What happened in the markets in Financial Year 2023?
Central Banks took aggressive action to reduce high inflation
During the 2022-23 financial year, central banks raised cash rates to help reduce inflation. The pace of these increases was the fastest since the early 1980’s, with cash rates increasing between 3-4% across Australia, US, and Europe, as depicted in Chart 1 below.
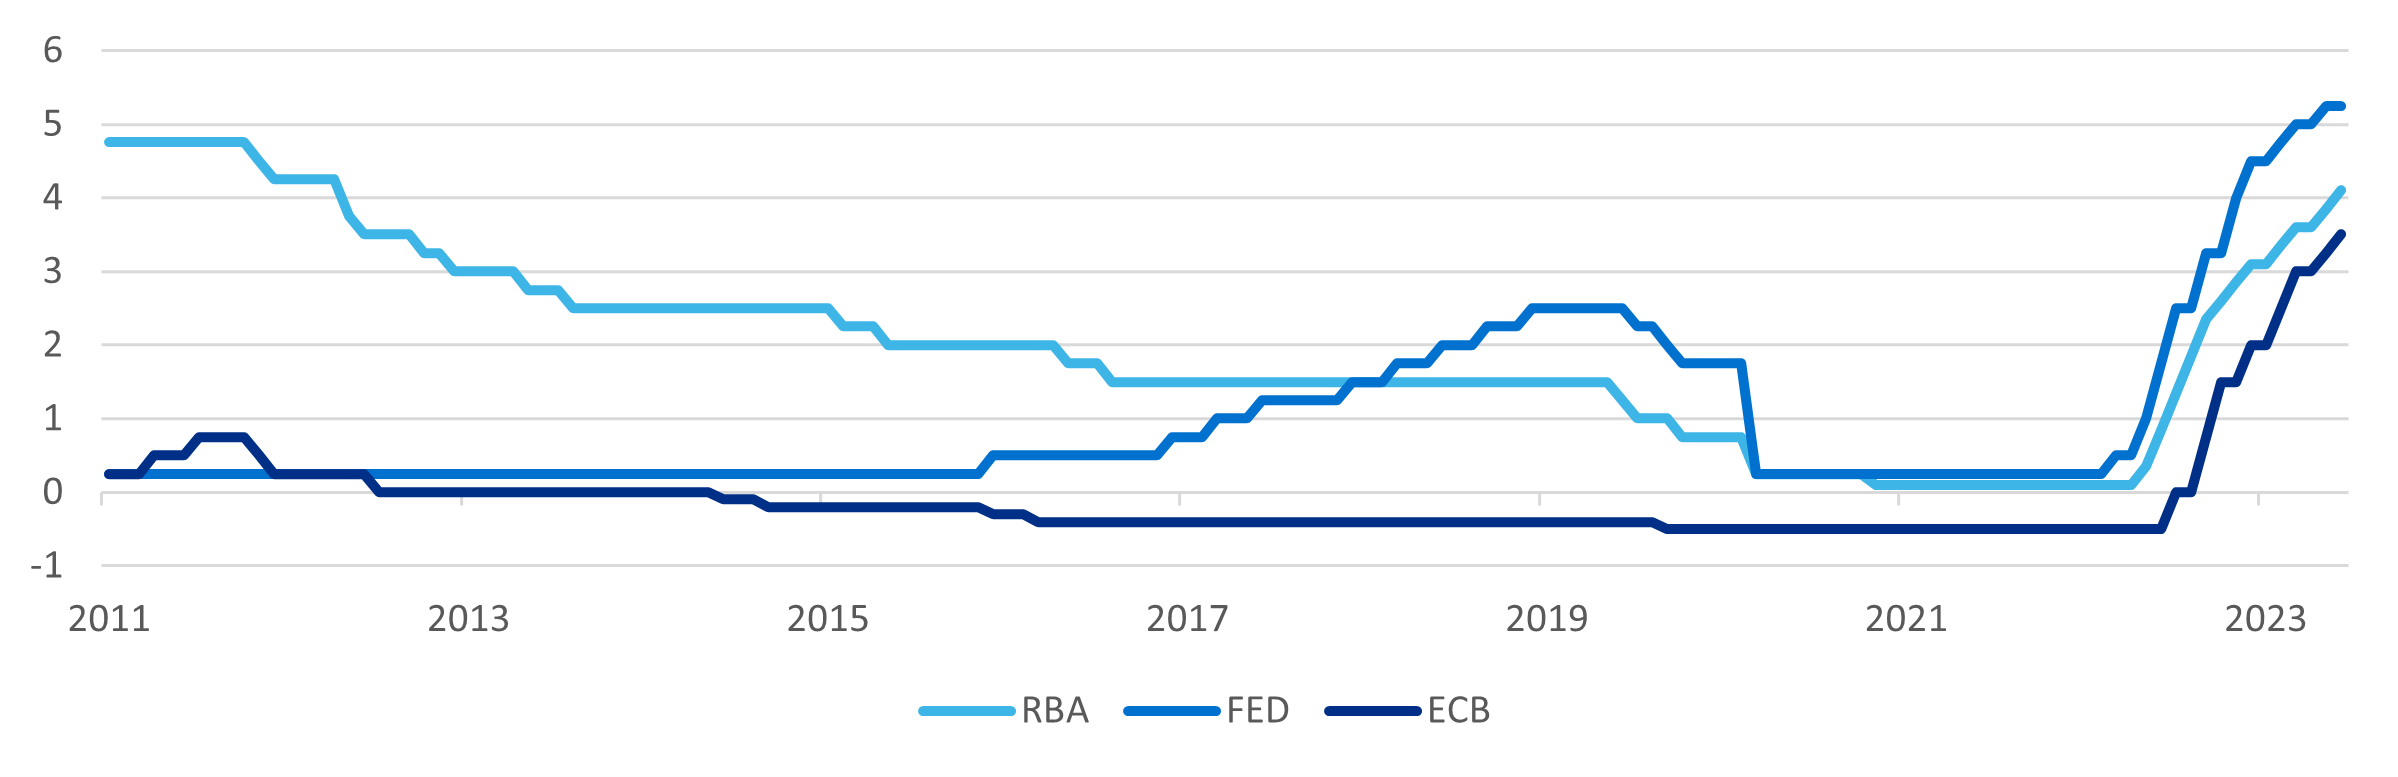
Reserve Bank of Australia (RBA), US Federal Reserve Board (FED), European Central Bank (ECB)
Source: Chart constructed from RBA published data. The RBA has not endorsed the use or publication of this chart.
Very low unemployment rates and moderate growth outcomes in economies led to central banks to react much faster than initially expected by investors. While there have been concerns around a global recession, it has not yet happened.
Headline inflation peaked during the financial year as global supply chain pressures eased, with oil and gas prices falling significantly from their Ukraine war highs, and the reopening of China following COVID disruptions assisted goods prices. Chart 2 depicts the path of inflation in the US, Europe, and Australia in recent years.
Chart 2: Annual inflation – Australia and advanced economies (%)
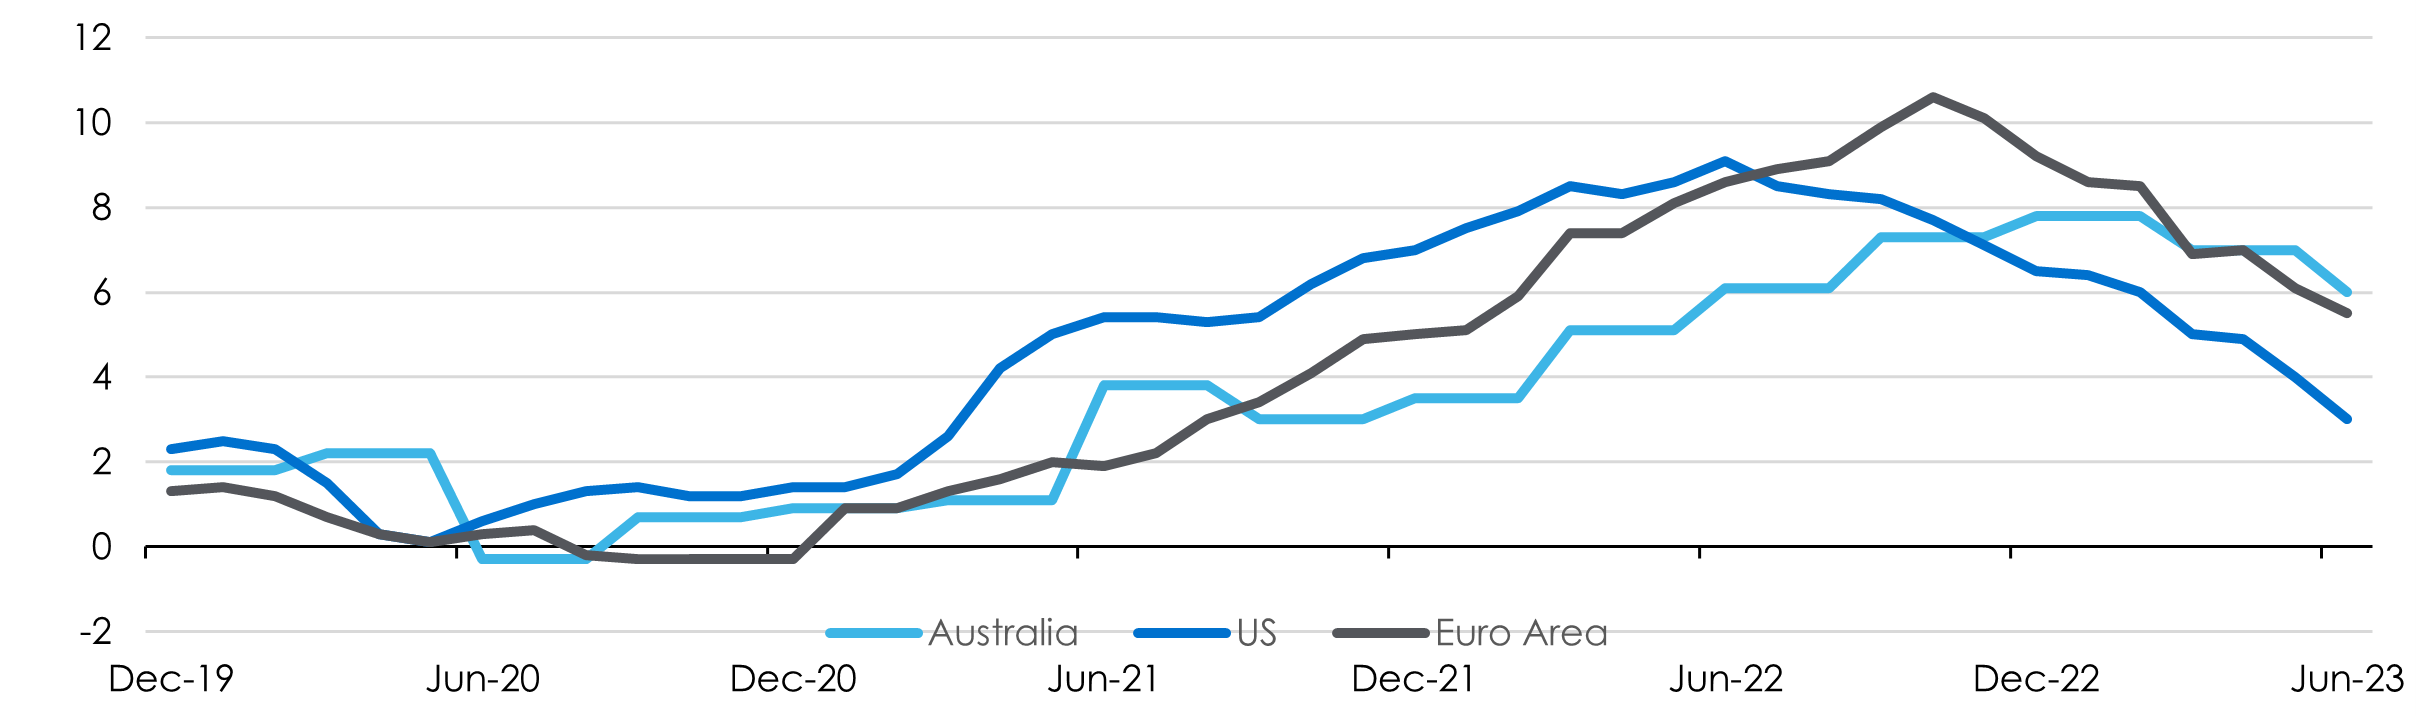
In the US, headline inflation has fallen significantly from a 40-year high of 9.1% in June 2022, to its current level of 3.0%. European and Australian inflation peaked later than the US and are also now falling rapidly.
Core inflation measures remain high, driven by service sector price rises and wage growth. Central banks remain focused on keeping monetary policy restrictive to return core inflation to target levels, but investors expect that cash rates are nearing their peak for this cycle.
Equity markets produced strong investment returns
Equity markets overcame the ongoing economic risks and delivered strong returns for the financial year
Valuations of the very large technology companies increased significantly as investors focused on their exposure to Artificial Intelligence applications (e.g. Nvidia, Meta, Apple, Microsoft, & Amazon) and drove equity market returns. The US market benefited significantly given its high weighting to the Information Technology (IT) sector.
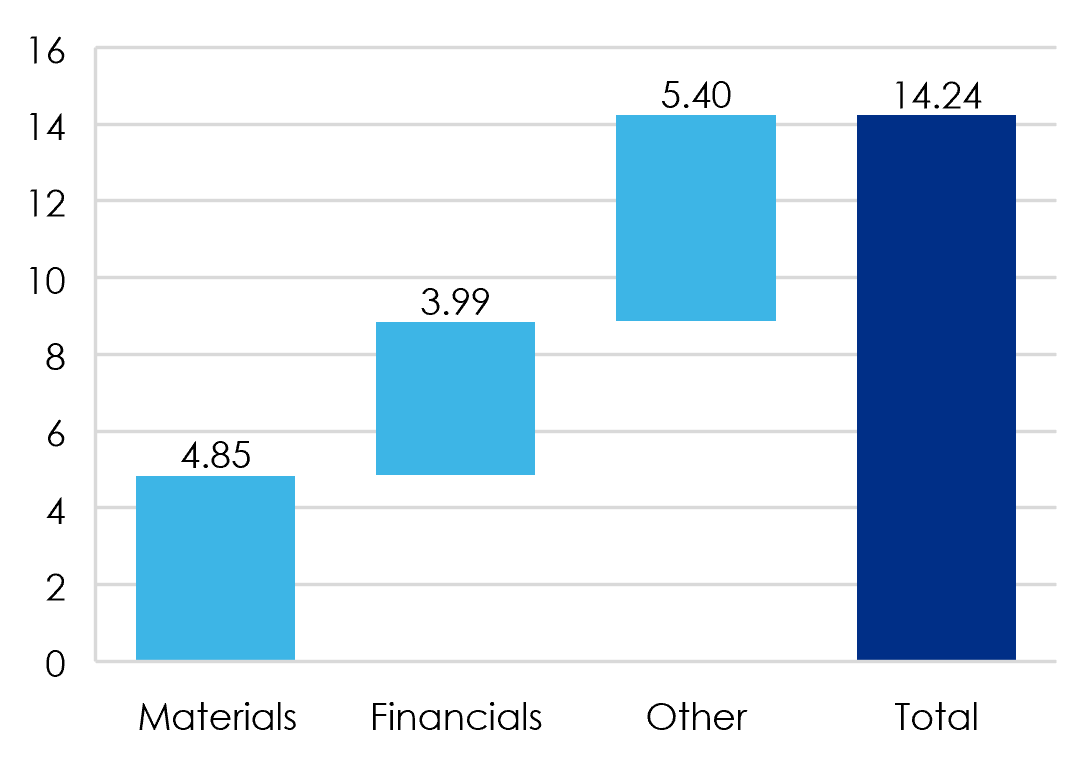
The IT sector also performed very strongly in the Australian equity market, however, due its smaller weighting, was not a primary contributor to the equity market’s return. Due to more than 50% of the Australian market residing in the Materials (e.g. BHP, Rio Tinto) and Financials (e.g. 4 major banks) sectors, their positive returns were the main contributors to the local market’s return.
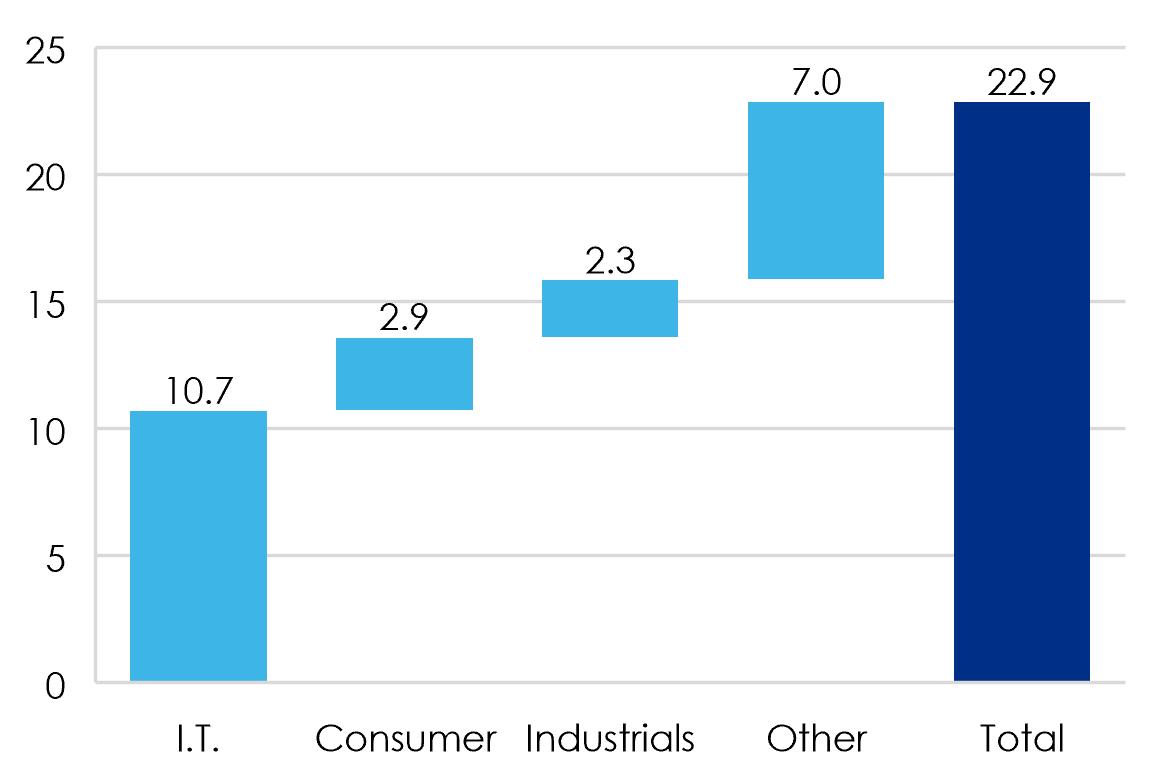
Consumer refers to Consumer Discretionary. S&P500 returns are in local currency.
Other asset classes produced mixed returns
After several years of near zero returns, the Cash asset class benefited from the RBA raising the Official Cash Rate from 0.85% to 4.10% over the financial year.
Shorter dated Fixed Interest assets delivered positive returns. However, longer dated Fixed Interest, with greater sensitivity to rising interest rates, produced a slightly negative outcome.
Despite the rising interest rates, Infrastructure asset class continued to produce positive returns with certain assets benefiting from their revenue streams being linked to inflation.
Property returns were mildly negative with the impact of higher interest rates on valuations exceeding rental income, particularly in the Office and Retail sectors. Industrial sector valuations remained stable.
What does this mean for your super?
Returns for all investment options for the year were positive, however as always, it is important to remember that your superannuation is a long-term investment. We are happy to report our investment options continue to provide strong long-term returns over 5 and 10 years, as shown in the table above.
We encourage our members to seek financial advice before making any changes to their superannuation investments. If you need help locating one, you can contact the Financial Planning Association of Australia.
If you have any questions in relation to this matter, please contact Super SA on (08) 8214 7800, via email supersa@sa.gov.au or via the online contact us form.